GKD-C QQE of Variety RSI [Loxx]Giga Kaleidoscope GKD-C QQE of Variety RSI is a Confirmation module included in Loxx's "Giga Kaleidoscope Modularized Trading System".
█ GKD-C QQE of Variety RSI
QQE: A Comprehensive Alternative to the Relative Strength Index
The Relative Strength Index (RSI) is a popular technical indicator that measures the speed and change of price movements to help traders identify potential trend reversals, overbought, and oversold conditions. Although the RSI is widely used, it has its limitations, and traders often seek alternative or complementary indicators to improve their market analysis. One such alternative is the Qualitative Quantitative Estimation (QQE) indicator, a comprehensive oscillator that combines the features of the RSI with additional smoothing and volatility adjustments. In the following, we will explore the QQE indicator, its calculation, and its potential benefits compared to using any type of RSI alone.
QQE Indicator
The QQE indicator was developed by an unknown author and is based on the RSI with additional modifications to enhance its performance. The QQE calculation involves three main steps:
1. The first step is to compute the RSI value for a specified period using the traditional RSI formula.
2. The second step is to apply a smoothing technique, such as the Wilder's smoothing or an exponential moving average (EMA), to the RSI value, resulting in the smoothed RSI.
3. The third step is to calculate the volatility-adjusted upper and lower bands (referred to as the QQE lines) around the smoothed RSI using an ATR-based (Average True Range) multiplier.
The QQE indicator is typically displayed as an oscillator with the smoothed RSI line in the middle and the upper and lower QQE lines acting as dynamic boundaries.
Comparison with the RSI
To better understand the potential benefits of the QQE indicator compared to using any type of RSI alone, let's examine its key features and how they may contribute to improved market analysis.
Advantages
1. The QQE indicator provides a more comprehensive view of the market by combining the strengths of the RSI with additional smoothing and volatility adjustments. This may result in a more reliable and accurate reflection of market conditions and price trends.
2. The smoothed RSI line in the QQE oscillator can help filter out noise and reduce the number of false signals often experienced when using the traditional RSI alone, making it easier for traders to identify genuine trend reversals and trading opportunities.
3. The dynamic QQE lines offer an additional layer of information by accounting for market volatility. This can help traders to better gauge the strength of price movements and identify potential support and resistance levels.
4. The QQE indicator can be used as a standalone tool or in combination with other technical indicators, providing traders with greater flexibility in their market analysis.
Disadvantages
1. The QQE indicator may be more complex to understand and implement than the traditional RSI due to the additional smoothing and volatility adjustments involved in its calculation.
2. As the QQE indicator is less widely known and used than the RSI, traders may find it more challenging to find resources and support for incorporating this indicator into their trading strategies.
Conclusion:
The QQE indicator is a versatile and comprehensive alternative to the traditional RSI, offering potential benefits in terms of noise reduction, volatility adjustment, and improved market analysis. However, it is important to recognize its limitations, such as increased complexity and limited resources compared to the RSI. Traders should carefully consider the potential advantages and drawbacks of using the QQE indicator before integrating it into their trading strategies. Ultimately, the choice between the QQE and any type of RSI will depend on individual traders' preferences and the specific market conditions they are analyzing.
This indicator includes 3 types of signals
1. Middle cross
2. Levels cross
3. Slow Trend cross
This indicator includes 9 types of RSI
1. Regular RSI
2. Slow RSI
3. Ehlers Smoothed RSI
4. Cutler's RSI or Rapid RSI
5. RSI T3
6. RSI DEMA
7. Harris' RSI
8. RSI TEMA
9. Jurik RSX
Regular RSI
The Relative Strength Index (RSI) is a widely used technical indicator in the field of financial market analysis. Developed by J. Welles Wilder Jr. in 1978, the RSI is a momentum oscillator that measures the speed and change of price movements. It helps traders identify potential trend reversals, overbought, and oversold conditions in a market.
The RSI is calculated based on the average gains and losses of an asset over a specified period, typically 14 days. The formula for calculating the RSI is as follows:
RSI = 100 - (100 / (1 + RS))
Where:
RS (Relative Strength) = Average gain over the specified period / Average loss over the specified period
The RSI ranges from 0 to 100, with values above 70 generally considered overbought (potentially indicating that the asset is overvalued and may experience a price decline) and values below 30 considered oversold (potentially indicating that the asset is undervalued and may experience a price increase).
Slow RSI
The Slow RSI is a variation of the standard RSI, which introduces a smoothing technique to the RSI calculation itself. The primary difference between the Slow RSI and the standard RSI lies in the calculation of the RSI value. In the Slow RSI, the current RSI value is calculated as a moving average of the previous RSI value and the standard RSI value for the current period.
The primary advantage of the Slow RSI is that it offers enhanced signal stability, reducing noise and potentially providing more reliable trading signals for traders.
Comparison with the original RSI
To better understand the potential advantages and disadvantages of the Slow RSI, it is essential to compare its performance against the original RSI.
Advantages
1. The Slow RSI provides enhanced signal stability by smoothing the RSI calculation, which can help traders better assess market conditions and identify potential overbought or oversold situations.
2. By offering more stable and reliable signals, the Slow RSI may improve the performance of trading strategies based on the RSI, especially in noisy or choppy market conditions.
Disadvantages
1. The smoothing technique employed by the Slow RSI may result in a slower response to changes in price momentum compared to the original RSI. This could lead to delayed signals for entering or exiting trades, which may not be ideal for short-term traders or fast-moving markets.
2. As the Slow RSI is less known and less widely used than the standard RSI, traders may find it more challenging to find resources and support for implementing this variation of the indicator.
The Slow RSI is an interesting modification of the standard RSI, offering potential benefits in terms of signal stability and reliability. However, it is crucial to recognize its limitations, such as a potentially slower response to changes in price momentum. Traders should carefully consider the potential advantages and drawbacks of using the Slow RSI compared to the original RSI before incorporating it into their trading strategies. Ultimately, the choice between the original RSI and the Slow RSI will depend on individual traders' preferences and the specific market conditions they are analyzing.
Ehlers Smoothed RSI
Ehlers Smoothed RSI is a variation of the standard RSI developed by John F. Ehlers, which introduces a smoothing technique to the price input data. The smoothing process involves averaging the current price with the previous two price values, which helps reduce noise and provide a more accurate representation of price momentum. The calculation of up and down price movements remains similar to the original RSI, but the smoothing technique alters the input data.
The primary advantage of Ehlers Smoothed RSI is that it reduces noise and offers a more accurate representation of price momentum, potentially providing more reliable signals for traders.
Comparison with the original RSI
To better understand the potential advantages and disadvantages of Ehlers Smoothed RSI, it is essential to compare its performance against the original RSI.
Advantages
1. Ehlers Smoothed RSI reduces noise by smoothing the price input data, which can help traders better assess market conditions and identify potential overbought or oversold situations.
2. By providing a more accurate representation of price momentum, Ehlers Smoothed RSI may offer more reliable signals for entering or exiting trades, potentially improving the performance of trading strategies based on the RSI.
Disadvantages
1. The smoothing technique employed by Ehlers Smoothed RSI may result in a slower response to changes in price momentum compared to the original RSI. This could lead to delayed signals for entering or exiting trades, which may not be ideal for short-term traders or fast-moving markets.
2. As Ehlers Smoothed RSI is less known and less widely used than the standard RSI, traders may find it more challenging to find resources and support for implementing this variation of the indicator.
Ehlers Smoothed RSI is an intriguing modification of the standard RSI, offering potential benefits in terms of noise reduction and accuracy. However, it is crucial to recognize its limitations, such as a potentially slower response to changes in price momentum. Traders should carefully consider the potential advantages and drawbacks of using Ehlers Smoothed RSI compared to the original RSI before incorporating it into their trading strategies. Ultimately, the choice between the original RSI and Ehlers Smoothed RSI will depend on individual traders' preferences and the specific market conditions they are analyzing.
Cutler's RSI or Rapid RSI
Cutler's RSI is a variation of the standard RSI, which modifies the calculation of average gains and losses. While the original RSI employs exponential moving averages (EMAs) for average gains and losses, Cutler's RSI utilizes simple moving averages (SMAs) instead. This change results in a slightly different behavior of the oscillator compared to the original RSI.
The primary advantage of Cutler's RSI is that it offers a simpler calculation method, which can potentially make it easier to understand and implement for traders. Additionally, by using SMAs, Cutler's RSI may provide a more consistent and stable representation of price momentum.
Comparison with the original RSI
It is essential to recognize the limitations and performance of Cutler's RSI compared to the original RSI to understand its potential advantages and disadvantages better.
Advantages
1. Cutler's RSI has a simpler calculation method, using SMAs instead of EMAs. This makes it easier to understand and implement for traders who prefer a more straightforward approach to technical analysis.
2. By using SMAs, Cutler's RSI may provide a more stable and consistent representation of price momentum, which can help traders better assess market conditions and identify potential overbought or oversold situations.
Disadvantages
1. The use of SMAs in Cutler's RSI may result in a slower response to changes in price momentum compared to the original RSI. This could lead to delayed signals for entering or exiting trades, which may not be ideal for short-term traders or fast-moving markets.
2. As Cutler's RSI is less known and less widely used than the standard RSI, it may be more challenging to find resources and support for implementing this variation of the indicator.
Cutler's RSI is an interesting modification of the standard RSI, offering potential benefits in terms of simplicity and stability. However, it is crucial to recognize its limitations, such as a potentially slower response to changes in price momentum. Traders should carefully consider the potential advantages and drawbacks of using Cutler's RSI compared to the original RSI before incorporating it into their trading strategies. Ultimately, the choice between the original RSI and Cutler's RSI will depend on individual traders' preferences and the specific market conditions they are analyzing.
RSI T3
The T3 RSI is a variation of the standard RSI that introduces the Triple Smoothed Exponential Moving Average (T3) into the calculation process. The primary difference between the T3 RSI and the standard RSI lies in the calculation of the average gains and losses. Instead of using simple moving averages or exponential moving averages, the T3 RSI utilizes T3 to calculate the average gains and losses for up and down price movements.
The primary advantage of the T3 RSI is that it offers enhanced responsiveness and accuracy compared to the original RSI, potentially providing more reliable trading signals for traders.
Comparison with the original RSI
To better understand the potential advantages and disadvantages of the T3 RSI, it is essential to compare its performance against the original RSI.
Advantages
1. The T3 RSI provides enhanced responsiveness and accuracy by incorporating the Triple Smoothed Exponential Moving Average into the calculation of average gains and losses. This can help traders better assess market conditions and identify potential overbought or oversold situations.
2. By offering more responsive and accurate signals, the T3 RSI may improve the performance of trading strategies based on the RSI, especially in fast-moving markets or during periods of high price volatility.
Disadvantages
1. The T3 RSI's increased responsiveness may result in more frequent trading signals, which could lead to higher trading costs or a higher likelihood of false signals.
2. As the T3 RSI is less known and less widely used than the standard RSI, traders may find it more challenging to find resources and support for implementing this variation of the indicator.
The T3 RSI is an innovative modification of the standard RSI, offering potential benefits in terms of responsiveness and accuracy. However, it is crucial to recognize its limitations, such as a potentially higher likelihood of false signals due to increased responsiveness. Traders should carefully consider the potential advantages and drawbacks of using the T3 RSI compared to the original RSI before incorporating it into their trading strategies. Ultimately, the choice between the original RSI and the T3 RSI will depend on individual traders' preferences and the specific market conditions they are analyzing.
RSI DEMA
The DEMA RSI is a variation of the standard RSI that introduces the Double Exponential Moving Average (DEMA) into the calculation process. The primary difference between the DEMA RSI and the standard RSI lies in the calculation of the average gains and losses. Instead of using simple moving averages or exponential moving averages, the DEMA RSI utilizes DEMA to calculate the average gains and losses for up and down price movements.
The primary advantage of the DEMA RSI is that it offers enhanced responsiveness and accuracy compared to the original RSI, potentially providing more reliable trading signals for traders.
Comparison with the original RSI
To better understand the potential advantages and disadvantages of the DEMA RSI, it is essential to compare its performance against the original RSI.
Advantages
1. The DEMA RSI provides enhanced responsiveness and accuracy by incorporating the Double Exponential Moving Average into the calculation of average gains and losses. This can help traders better assess market conditions and identify potential overbought or oversold situations.
2. By offering more responsive and accurate signals, the DEMA RSI may improve the performance of trading strategies based on the RSI, especially in fast-moving markets or during periods of high price volatility.
Disadvantages
1. The DEMA RSI's increased responsiveness may result in more frequent trading signals, which could lead to higher trading costs or a higher likelihood of false signals.
2. As the DEMA RSI is less known and less widely used than the standard RSI, traders may find it more challenging to find resources and support for implementing this variation of the indicator.
The DEMA RSI is an innovative modification of the standard RSI, offering potential benefits in terms of responsiveness and accuracy. However, it is crucial to recognize its limitations, such as a potentially higher likelihood of false signals due to increased responsiveness. Traders should carefully consider the potential advantages and drawbacks of using the DEMA RSI compared to the original RSI before incorporating it into their trading strategies. Ultimately, the choice between the original RSI and the DEMA RSI will depend on individual traders' preferences and the specific market conditions they are analyzing.
Harris' RSI
Harris' RSI is a variation of the standard RSI, designed to address some of its limitations and improve its performance in detecting potential trend reversals and filtering out noise. The key difference between the Harris' RSI and the standard RSI lies in the calculation of average gains and losses. While the standard RSI calculation uses exponential moving averages (EMAs) of gains and losses, Harris' RSI uses a different approach to compute the average gains and losses based on the number of up and down price movements.
The primary advantage of Harris' RSI is that it aims to provide a more adaptive and responsive indicator, making it better suited for detecting potential trend reversals and filtering out noise in the market. By taking into account the number of up and down price movements, Harris' RSI can be more sensitive to changes in the trend, potentially providing earlier signals for entering or exiting trades.
Comparison with the original RSI
While Harris' RSI offers potential improvements over the standard RSI, it is essential to recognize its limitations and compare its performance against the original RSI.
Advantages
1. Harris' RSI can potentially provide earlier signals for trend reversals due to its sensitivity to the number of up and down price movements. This can help traders to identify better entry and exit points in the market.
2. By focusing on the number of up and down price movements, Harris' RSI can filter out noise in the market, reducing the likelihood of false signals that may lead to losing trades.
Disadvantages
1. The increased sensitivity of Harris' RSI to price movements can lead to more frequent signals, which may result in overtrading and increased trading costs.
2. Harris' RSI is less known and less widely used than the standard RSI, which may make it more challenging to find resources and support for implementing this variation of the indicator.
Harris' RSI is an interesting variation of the standard RSI, offering potential advantages in detecting trend reversals and filtering out noise. However, like any technical indicator, it has its limitations and may not be suitable for all trading styles or market conditions. Traders should carefully consider the potential benefits and drawbacks of using Harris' RSI compared to the original RSI before incorporating it into their trading strategies. Ultimately, the choice between the original RSI and Harris' RSI will depend on individual traders' preferences and the specific market conditions they are analyzing.
RSI TEMA
The TEMA RSI is a variation of the standard RSI that introduces the Triple Exponential Moving Average (TEMA) into the calculation process. The primary difference between the TEMA RSI and the standard RSI lies in the calculation of the average gains and losses. Instead of using simple moving averages or exponential moving averages, the TEMA RSI utilizes TEMA to calculate the average gains and losses for up and down price movements.
The primary advantage of the TEMA RSI is that it offers enhanced responsiveness and accuracy compared to the original RSI, potentially providing more reliable trading signals for traders.
Comparison with the original RSI
To better understand the potential advantages and disadvantages of the TEMA RSI, it is essential to compare its performance against the original RSI.
Advantages
1. The TEMA RSI provides enhanced responsiveness and accuracy by incorporating the Triple Exponential Moving Average into the calculation of average gains and losses. This can help traders better assess market conditions and identify potential overbought or oversold situations.
2. By offering more responsive and accurate signals, the TEMA RSI may improve the performance of trading strategies based on the RSI, especially in fast-moving markets or during periods of high price volatility.
Disadvantages
1. The TEMA RSI's increased responsiveness may result in more frequent trading signals, which could lead to higher trading costs or a higher likelihood of false signals.
2. As the TEMA RSI is less known and less widely used than the standard RSI, traders may find it more challenging to find resources and support for implementing this variation of the indicator.
The TEMA RSI is an innovative modification of the standard RSI, offering potential benefits in terms of responsiveness and accuracy. However, it is crucial to recognize its limitations, such as a potentially higher likelihood of false signals due to increased responsiveness. Traders should carefully consider the potential advantages and drawbacks of using the TEMA RSI compared to the original RSI before incorporating it into their trading strategies. Ultimately, the choice between the original RSI and the TEMA RSI will depend on individual traders' preferences and the specific market conditions they are analyzing.
Jurik RSX
The Jurik RSX, developed by Mark Jurik, is a variation of the standard RSI that aims to provide a smoother and more responsive indicator by applying a unique smoothing algorithm based on a series of recursive calculations. The Jurik RSX calculates the price momentum (mom) and the absolute price momentum (moa) using a three-stage filtering process, which ultimately results in a smoother and more responsive output compared to the original RSI.
Comparison with the original RSI
To better understand the potential benefits and drawbacks of the Jurik RSX, it is essential to compare its performance against the original RSI.
Advantages
1. The Jurik RSX offers enhanced responsiveness and smoothness due to its unique recursive filtering process, allowing traders to better identify potential trend reversals, overbought, and oversold conditions.
2. The improved responsiveness of the Jurik RSX may result in more timely trading signals, helping traders to capitalize on opportunities more effectively, especially in fast-moving markets or during periods of high price volatility.
Disadvantages
1. The increased complexity of the Jurik RSX calculation may make it more challenging for traders to understand and implement compared to the original RSI.
2. As the Jurik RSX is less known and less widely used than the standard RSI, traders may find it more difficult to find resources and support for implementing this variation of the indicator.
The Jurik RSX is an innovative modification of the standard RSI, offering potential benefits in terms of responsiveness and smoothness. However, it is crucial to recognize its limitations, such as increased complexity and limited resources compared to the original RSI. Traders should carefully consider the potential advantages and drawbacks of using the Jurik RSX before incorporating it into their trading strategies. Ultimately, the choice between the original RSI and the Jurik RSX will depend on individual traders' preferences and the specific market conditions they are analyzing.
Additional Features
This indicator allows you to select from 33 source types. They are as follows:
Close
Open
High
Low
Median
Typical
Weighted
Average
Average Median Body
Trend Biased
Trend Biased (Extreme)
HA Close
HA Open
HA High
HA Low
HA Median
HA Typical
HA Weighted
HA Average
HA Average Median Body
HA Trend Biased
HA Trend Biased (Extreme)
HAB Close
HAB Open
HAB High
HAB Low
HAB Median
HAB Typical
HAB Weighted
HAB Average
HAB Average Median Body
HAB Trend Biased
HAB Trend Biased (Extreme)
What are Heiken Ashi "better" candles?
Heiken Ashi "better" candles are a modified version of the standard Heiken Ashi candles, which are a popular charting technique used in technical analysis. Heiken Ashi candles help traders identify trends and potential reversal points by smoothing out price data and reducing market noise. The "better formula" was proposed by Sebastian Schmidt in an article published by BNP Paribas in Warrants & Zertifikate, a German magazine, in August 2004. The aim of this formula is to further improve the smoothing of the Heiken Ashi chart and enhance its effectiveness in identifying trends and reversals.
Standard Heiken Ashi candles are calculated using the following formulas:
Heiken Ashi Close = (Open + High + Low + Close) / 4
Heiken Ashi Open = (Previous Heiken Ashi Open + Previous Heiken Ashi Close) / 2
Heiken Ashi High = Max (High, Heiken Ashi Open, Heiken Ashi Close)
Heiken Ashi Low = Min (Low, Heiken Ashi Open, Heiken Ashi Close)
The "better formula" modifies the standard Heiken Ashi calculation by incorporating additional smoothing, which can help reduce noise and make it easier to identify trends and reversals. The modified formulas for Heiken Ashi "better" candles are as follows:
Better Heiken Ashi Close = (Open + High + Low + Close) / 4
Better Heiken Ashi Open = (Previous Better Heiken Ashi Open + Previous Better Heiken Ashi Close) / 2
Better Heiken Ashi High = Max (High, Better Heiken Ashi Open, Better Heiken Ashi Close)
Better Heiken Ashi Low = Min (Low, Better Heiken Ashi Open, Better Heiken Ashi Close)
Smoothing Factor = 2 / (N + 1), where N is the chosen period for smoothing
Smoothed Better Heiken Ashi Open = (Better Heiken Ashi Open * Smoothing Factor) + (Previous Smoothed Better Heiken Ashi Open * (1 - Smoothing Factor))
Smoothed Better Heiken Ashi Close = (Better Heiken Ashi Close * Smoothing Factor) + (Previous Smoothed Better Heiken Ashi Close * (1 - Smoothing Factor))
The smoothed Better Heiken Ashi Open and Close values are then used to calculate the smoothed Better Heiken Ashi High and Low values, resulting in "better" candles that provide a clearer representation of the market trend and potential reversal points.
It's important to note that, like any other technical analysis tool, Heiken Ashi "better" candles are not foolproof and should be used in conjunction with other indicators and analysis techniques to make well-informed trading decisions.
Heiken Ashi "better" candles, as mentioned previously, provide a clearer representation of market trends and potential reversal points by reducing noise and smoothing out price data. When using these candles in conjunction with other technical analysis tools and indicators, traders can gain valuable insights into market behavior and make more informed decisions.
To effectively use Heiken Ashi "better" candles in your trading strategy, consider the following tips:
Trend Identification: Heiken Ashi "better" candles can help you identify the prevailing trend in the market. When the majority of the candles are green (or another color, depending on your chart settings) and there are no or few lower wicks, it may indicate a strong uptrend. Conversely, when the majority of the candles are red (or another color) and there are no or few upper wicks, it may signal a strong downtrend.
Trend Reversals: Look for potential trend reversals when a change in the color of the candles occurs, especially when accompanied by longer wicks. For example, if a green candle with a long lower wick is followed by a red candle, it could indicate a bearish reversal. Similarly, a red candle with a long upper wick followed by a green candle may suggest a bullish reversal.
Support and Resistance: You can use Heiken Ashi "better" candles to identify potential support and resistance levels. When the candles are consistently moving in one direction and then suddenly change color with longer wicks, it could indicate the presence of a support or resistance level.
Stop-Loss and Take-Profit: Using Heiken Ashi "better" candles can help you manage risk by determining optimal stop-loss and take-profit levels. For instance, you can place your stop-loss below the low of the most recent green candle in an uptrend or above the high of the most recent red candle in a downtrend.
Confirming Signals: Heiken Ashi "better" candles should be used in conjunction with other technical indicators, such as moving averages, oscillators, or chart patterns, to confirm signals and improve the accuracy of your analysis.
In this implementation, you have the choice of AMA, KAMA, or T3 smoothing. These are as follows:
Kaufman Adaptive Moving Average (KAMA)
The Kaufman Adaptive Moving Average (KAMA) is a type of adaptive moving average used in technical analysis to smooth out price fluctuations and identify trends. The KAMA adjusts its smoothing factor based on the market's volatility, making it more responsive in volatile markets and smoother in calm markets. The KAMA is calculated using three different efficiency ratios that determine the appropriate smoothing factor for the current market conditions. These ratios are based on the noise level of the market, the speed at which the market is moving, and the length of the moving average. The KAMA is a popular choice among traders who prefer to use adaptive indicators to identify trends and potential reversals.
Adaptive Moving Average
The Adaptive Moving Average (AMA) is a type of moving average that adjusts its sensitivity to price movements based on market conditions. It uses a ratio between the current price and the highest and lowest prices over a certain lookback period to determine its level of smoothing. The AMA can help reduce lag and increase responsiveness to changes in trend direction, making it useful for traders who want to follow trends while avoiding false signals. The AMA is calculated by multiplying a smoothing constant with the difference between the current price and the previous AMA value, then adding the result to the previous AMA value.
T3
The T3 moving average is a type of technical indicator used in financial analysis to identify trends in price movements. It is similar to the Exponential Moving Average (EMA) and the Double Exponential Moving Average (DEMA), but uses a different smoothing algorithm.
The T3 moving average is calculated using a series of exponential moving averages that are designed to filter out noise and smooth the data. The resulting smoothed data is then weighted with a non-linear function to produce a final output that is more responsive to changes in trend direction.
The T3 moving average can be customized by adjusting the length of the moving average, as well as the weighting function used to smooth the data. It is commonly used in conjunction with other technical indicators as part of a larger trading strategy.
█ Giga Kaleidoscope Modularized Trading System
Core components of an NNFX algorithmic trading strategy
The NNFX algorithm is built on the principles of trend, momentum, and volatility. There are six core components in the NNFX trading algorithm:
1. Volatility - price volatility; e.g., Average True Range, True Range Double, Close-to-Close, etc.
2. Baseline - a moving average to identify price trend
3. Confirmation 1 - a technical indicator used to identify trends
4. Confirmation 2 - a technical indicator used to identify trends
5. Continuation - a technical indicator used to identify trends
6. Volatility/Volume - a technical indicator used to identify volatility/volume breakouts/breakdown
7. Exit - a technical indicator used to determine when a trend is exhausted
What is Volatility in the NNFX trading system?
In the NNFX (No Nonsense Forex) trading system, ATR (Average True Range) is typically used to measure the volatility of an asset. It is used as a part of the system to help determine the appropriate stop loss and take profit levels for a trade. ATR is calculated by taking the average of the true range values over a specified period.
True range is calculated as the maximum of the following values:
-Current high minus the current low
-Absolute value of the current high minus the previous close
-Absolute value of the current low minus the previous close
ATR is a dynamic indicator that changes with changes in volatility. As volatility increases, the value of ATR increases, and as volatility decreases, the value of ATR decreases. By using ATR in NNFX system, traders can adjust their stop loss and take profit levels according to the volatility of the asset being traded. This helps to ensure that the trade is given enough room to move, while also minimizing potential losses.
Other types of volatility include True Range Double (TRD), Close-to-Close, and Garman-Klass
What is a Baseline indicator?
The baseline is essentially a moving average, and is used to determine the overall direction of the market.
The baseline in the NNFX system is used to filter out trades that are not in line with the long-term trend of the market. The baseline is plotted on the chart along with other indicators, such as the Moving Average (MA), the Relative Strength Index (RSI), and the Average True Range (ATR).
Trades are only taken when the price is in the same direction as the baseline. For example, if the baseline is sloping upwards, only long trades are taken, and if the baseline is sloping downwards, only short trades are taken. This approach helps to ensure that trades are in line with the overall trend of the market, and reduces the risk of entering trades that are likely to fail.
By using a baseline in the NNFX system, traders can have a clear reference point for determining the overall trend of the market, and can make more informed trading decisions. The baseline helps to filter out noise and false signals, and ensures that trades are taken in the direction of the long-term trend.
What is a Confirmation indicator?
Confirmation indicators are technical indicators that are used to confirm the signals generated by primary indicators. Primary indicators are the core indicators used in the NNFX system, such as the Average True Range (ATR), the Moving Average (MA), and the Relative Strength Index (RSI).
The purpose of the confirmation indicators is to reduce false signals and improve the accuracy of the trading system. They are designed to confirm the signals generated by the primary indicators by providing additional information about the strength and direction of the trend.
Some examples of confirmation indicators that may be used in the NNFX system include the Bollinger Bands, the MACD (Moving Average Convergence Divergence), and the MACD Oscillator. These indicators can provide information about the volatility, momentum, and trend strength of the market, and can be used to confirm the signals generated by the primary indicators.
In the NNFX system, confirmation indicators are used in combination with primary indicators and other filters to create a trading system that is robust and reliable. By using multiple indicators to confirm trading signals, the system aims to reduce the risk of false signals and improve the overall profitability of the trades.
What is a Continuation indicator?
In the NNFX (No Nonsense Forex) trading system, a continuation indicator is a technical indicator that is used to confirm a current trend and predict that the trend is likely to continue in the same direction. A continuation indicator is typically used in conjunction with other indicators in the system, such as a baseline indicator, to provide a comprehensive trading strategy.
What is a Volatility/Volume indicator?
Volume indicators, such as the On Balance Volume (OBV), the Chaikin Money Flow (CMF), or the Volume Price Trend (VPT), are used to measure the amount of buying and selling activity in a market. They are based on the trading volume of the market, and can provide information about the strength of the trend. In the NNFX system, volume indicators are used to confirm trading signals generated by the Moving Average and the Relative Strength Index. Volatility indicators include Average Direction Index, Waddah Attar, and Volatility Ratio. In the NNFX trading system, volatility is a proxy for volume and vice versa.
By using volume indicators as confirmation tools, the NNFX trading system aims to reduce the risk of false signals and improve the overall profitability of trades. These indicators can provide additional information about the market that is not captured by the primary indicators, and can help traders to make more informed trading decisions. In addition, volume indicators can be used to identify potential changes in market trends and to confirm the strength of price movements.
What is an Exit indicator?
The exit indicator is used in conjunction with other indicators in the system, such as the Moving Average (MA), the Relative Strength Index (RSI), and the Average True Range (ATR), to provide a comprehensive trading strategy.
The exit indicator in the NNFX system can be any technical indicator that is deemed effective at identifying optimal exit points. Examples of exit indicators that are commonly used include the Parabolic SAR, the Average Directional Index (ADX), and the Chandelier Exit.
The purpose of the exit indicator is to identify when a trend is likely to reverse or when the market conditions have changed, signaling the need to exit a trade. By using an exit indicator, traders can manage their risk and prevent significant losses.
In the NNFX system, the exit indicator is used in conjunction with a stop loss and a take profit order to maximize profits and minimize losses. The stop loss order is used to limit the amount of loss that can be incurred if the trade goes against the trader, while the take profit order is used to lock in profits when the trade is moving in the trader's favor.
Overall, the use of an exit indicator in the NNFX trading system is an important component of a comprehensive trading strategy. It allows traders to manage their risk effectively and improve the profitability of their trades by exiting at the right time.
How does Loxx's GKD (Giga Kaleidoscope Modularized Trading System) implement the NNFX algorithm outlined above?
Loxx's GKD v1.0 system has five types of modules (indicators/strategies). These modules are:
1. GKD-BT - Backtesting module (Volatility, Number 1 in the NNFX algorithm)
2. GKD-B - Baseline module (Baseline and Volatility/Volume, Numbers 1 and 2 in the NNFX algorithm)
3. GKD-C - Confirmation 1/2 and Continuation module (Confirmation 1/2 and Continuation, Numbers 3, 4, and 5 in the NNFX algorithm)
4. GKD-V - Volatility/Volume module (Confirmation 1/2, Number 6 in the NNFX algorithm)
5. GKD-E - Exit module (Exit, Number 7 in the NNFX algorithm)
(additional module types will added in future releases)
Each module interacts with every module by passing data between modules. Data is passed between each module as described below:
GKD-B => GKD-V => GKD-C(1) => GKD-C(2) => GKD-C(Continuation) => GKD-E => GKD-BT
That is, the Baseline indicator passes its data to Volatility/Volume. The Volatility/Volume indicator passes its values to the Confirmation 1 indicator. The Confirmation 1 indicator passes its values to the Confirmation 2 indicator. The Confirmation 2 indicator passes its values to the Continuation indicator. The Continuation indicator passes its values to the Exit indicator, and finally, the Exit indicator passes its values to the Backtest strategy.
This chaining of indicators requires that each module conform to Loxx's GKD protocol, therefore allowing for the testing of every possible combination of technical indicators that make up the six components of the NNFX algorithm.
What does the application of the GKD trading system look like?
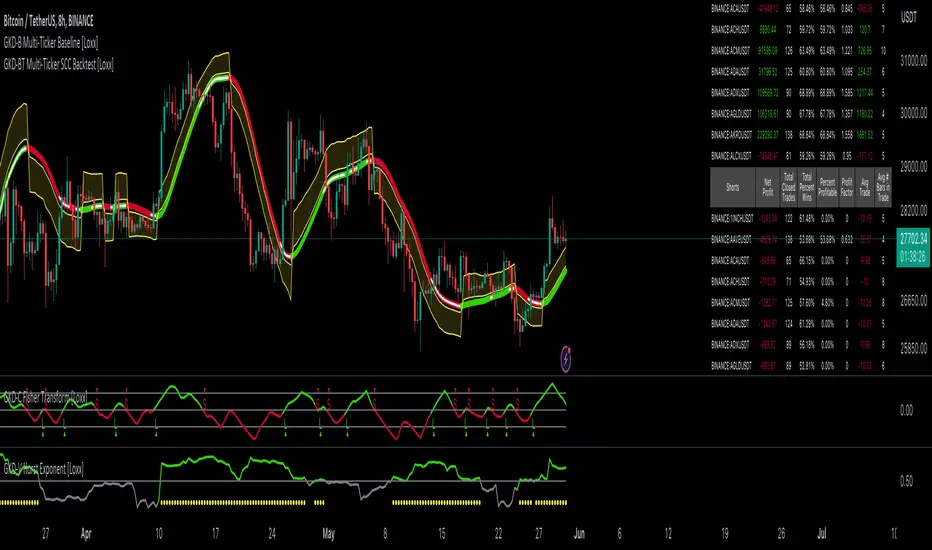
Example trading system:
Backtest: Strategy with 1-3 take profits, trailing stop loss, multiple types of PnL volatility, and 2 backtesting styles
Baseline: Hull Moving Average
Volatility/Volume: Hurst Exponent
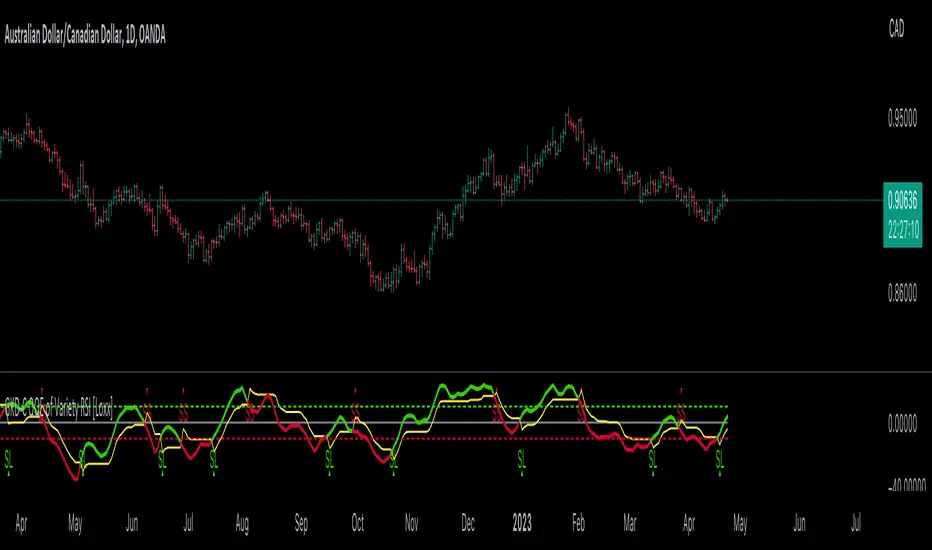
Confirmation 1: QQE of Variety RSI as shown on the chart above
Confirmation 2: Williams Percent Range
Continuation: QQE of Variety RSI
Exit: Rex Oscillator
Each GKD indicator is denoted with a module identifier of either: GKD-BT, GKD-B, GKD-C, GKD-V, or GKD-E. This allows traders to understand to which module each indicator belongs and where each indicator fits into the GKD protocol chain.
Giga Kaleidoscope Modularized Trading System Signals (based on the NNFX algorithm)
Standard Entry
1. GKD-C Confirmation 1 Signal
2. GKD-B Baseline agrees
3. Price is within a range of 0.2x Volatility and 1.0x Volatility of the Goldie Locks Mean
4. GKD-C Confirmation 2 agrees
5. GKD-V Volatility/Volume agrees
Baseline Entry
1. GKD-B Baseline signal
2. GKD-C Confirmation 1 agrees
3. Price is within a range of 0.2x Volatility and 1.0x Volatility of the Goldie Locks Mean
4. GKD-C Confirmation 2 agrees
5. GKD-V Volatility/Volume agrees
6. GKD-C Confirmation 1 signal was less than 7 candles prior
Volatility/Volume Entry
1. GKD-V Volatility/Volume signal
2. GKD-C Confirmation 1 agrees
3. Price is within a range of 0.2x Volatility and 1.0x Volatility of the Goldie Locks Mean
4. GKD-C Confirmation 2 agrees
5. GKD-B Baseline agrees
6. GKD-C Confirmation 1 signal was less than 7 candles prior
Continuation Entry
1. Standard Entry, Baseline Entry, or Pullback; entry triggered previously
2. GKD-B Baseline hasn't crossed since entry signal trigger
3. GKD-C Confirmation Continuation Indicator signals
4. GKD-C Confirmation 1 agrees
5. GKD-B Baseline agrees
6. GKD-C Confirmation 2 agrees
1-Candle Rule Standard Entry
1. GKD-C Confirmation 1 signal
2. GKD-B Baseline agrees
3. Price is within a range of 0.2x Volatility and 1.0x Volatility of the Goldie Locks Mean
Next Candle:
1. Price retraced (Long: close < close or Short: close > close )
2. GKD-B Baseline agrees
3. GKD-C Confirmation 1 agrees
4. GKD-C Confirmation 2 agrees
5. GKD-V Volatility/Volume agrees
1-Candle Rule Baseline Entry
1. GKD-B Baseline signal
2. GKD-C Confirmation 1 agrees
3. Price is within a range of 0.2x Volatility and 1.0x Volatility of the Goldie Locks Mean
4. GKD-C Confirmation 1 signal was less than 7 candles prior
Next Candle:
1. Price retraced (Long: close < close or Short: close > close )
2. GKD-B Baseline agrees
3. GKD-C Confirmation 1 agrees
4. GKD-C Confirmation 2 agrees
5. GKD-V Volatility/Volume Agrees
1-Candle Rule Volatility/Volume Entry
1. GKD-V Volatility/Volume signal
2. GKD-C Confirmation 1 agrees
3. Price is within a range of 0.2x Volatility and 1.0x Volatility of the Goldie Locks Mean
4. GKD-C Confirmation 1 signal was less than 7 candles prior
Next Candle:
1. Price retraced (Long: close < close or Short: close > close)
2. GKD-B Volatility/Volume agrees
3. GKD-C Confirmation 1 agrees
4. GKD-C Confirmation 2 agrees
5. GKD-B Baseline agrees
PullBack Entry
1. GKD-B Baseline signal
2. GKD-C Confirmation 1 agrees
3. Price is beyond 1.0x Volatility of Baseline
Next Candle:
1. Price is within a range of 0.2x Volatility and 1.0x Volatility of the Goldie Locks Mean
2. GKD-C Confirmation 1 agrees
3. GKD-C Confirmation 2 agrees
4. GKD-V Volatility/Volume Agrees
]█ Setting up the GKD
The GKD system involves chaining indicators together. These are the steps to set this up.
Use a GKD-C indicator alone on a chart
1. Inside the GKD-C indicator, change the "Confirmation Type" setting to "Solo Confirmation Simple"
Use a GKD-V indicator alone on a chart
**nothing, it's already useable on the chart without any settings changes
Use a GKD-B indicator alone on a chart
**nothing, it's already useable on the chart without any settings changes
Baseline (Baseline, Backtest)
1. Import the GKD-B Baseline into the GKD-BT Backtest: "Input into Volatility/Volume or Backtest (Baseline testing)"
2. Inside the GKD-BT Backtest, change the setting "Backtest Special" to "Baseline"
Volatility/Volume (Volatility/Volume, Backte st)
1. Inside the GKD-V indicator, change the "Testing Type" setting to "Solo"
2. Inside the GKD-V indicator, change the "Signal Type" setting to "Crossing" (neither traditional nor both can be backtested)
3. Import the GKD-V indicator into the GKD-BT Backtest: "Input into C1 or Backtest"
4. Inside the GKD-BT Backtest, change the setting "Backtest Special" to "Volatility/Volume"
5. Inside the GKD-BT Backtest, a) change the setting "Backtest Type" to "Trading" if using a directional GKD-V indicator; or, b) change the setting "Backtest Type" to "Full" if using a directional or non-directional GKD-V indicator (non-directional GKD-V can only test Longs and Shorts separately)
6. If "Backtest Type" is set to "Full": Inside the GKD-BT Backtest, change the setting "Backtest Side" to "Long" or "Short
7. If "Backtest Type" is set to "Full": To allow the system to open multiple orders at one time so you test all Longs or Shorts, open the GKD-BT Backtest, click the tab "Properties" and then insert a value of something like 10 orders into the "Pyramiding" settings. This will allow 10 orders to be opened at one time which should be enough to catch all possible Longs or Shorts.
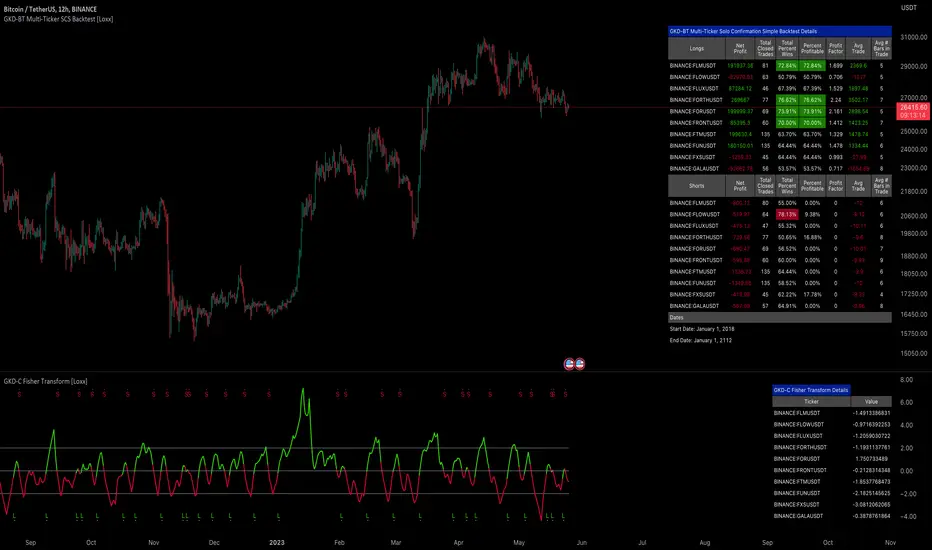
Solo Confirmation Simple (Confirmation, Backtest)
1. Inside the GKD-C indicator, change the "Confirmation Type" setting to "Solo Confirmation Simple"
1. Import the GKD-C indicator into the GKD-BT Backtest: "Input into Backtest"
2. Inside the GKD-BT Backtest, change the setting "Backtest Special" to "Solo Confirmation Simple"
Solo Confirmation Complex without Exits (Baseline, Volatility/Volume, Confirmation, Backtest)
1. Inside the GKD-V indicator, change the "Testing Type" setting to "Chained"
2. Import the GKD-B Baseline into the GKD-V indicator: "Input into Volatility/Volume or Backtest (Baseline testing)"
3. Inside the GKD-C indicator, change the "Confirmation Type" setting to "Solo Confirmation Complex"
4. Import the GKD-V indicator into the GKD-C indicator: "Input into C1 or Backtest"
5. Inside the GKD-BT Backtest, change the setting "Backtest Special" to "GKD Full wo/ Exits"
6. Import the GKD-C into the GKD-BT Backtest: "Input into Exit or Backtest"
Solo Confirmation Complex with Exits (Baseline, Volatility/Volume, Confirmation, Exit, Backtest)
1. Inside the GKD-V indicator, change the "Testing Type" setting to "Chained"
2. Import the GKD-B Baseline into the GKD-V indicator: "Input into Volatility/Volume or Backtest (Baseline testing)"
3. Inside the GKD-C indicator, change the "Confirmation Type" setting to "Solo Confirmation Complex"
4. Import the GKD-V indicator into the GKD-C indicator: "Input into C1 or Backtest"
5. Import the GKD-C indicator into the GKD-E indicator: "Input into Exit"
6. Inside the GKD-BT Backtest, change the setting "Backtest Special" to "GKD Full w/ Exits"
7. Import the GKD-E into the GKD-BT Backtest: "Input into Backtest"
Full GKD without Exits (Baseline, Volatility/Volume, Confirmation 1, Confirmation 2, Continuation, Backtest)
1. Inside the GKD-V indicator, change the "Testing Type" setting to "Chained"
2. Import the GKD-B Baseline into the GKD-V indicator: "Input into Volatility/Volume or Backtest (Baseline testing)"
3. Inside the GKD-C 1 indicator, change the "Confirmation Type" setting to "Confirmation 1"
4. Import the GKD-V indicator into the GKD-C 1 indicator: "Input into C1 or Backtest"
5. Inside the GKD-C 2 indicator, change the "Confirmation Type" setting to "Confirmation 2"
6. Import the GKD-C 1 indicator into the GKD-C 2 indicator: "Input into C2"
7. Inside the GKD-C Continuation indicator, change the "Confirmation Type" setting to "Continuation"
8. Inside the GKD-BT Backtest, change the setting "Backtest Special" to "GKD Full wo/ Exits"
9. Import the GKD-E into the GKD-BT Backtest: "Input into Exit or Backtest"
Full GKD with Exits (Baseline, Volatility/Volume, Confirmation 1, Confirmation 2, Continuation, Exit, Backtest)
1. Inside the GKD-V indicator, change the "Testing Type" setting to "Chained"
2. Import the GKD-B Baseline into the GKD-V indicator: "Input into Volatility/Volume or Backtest (Baseline testing)"
3. Inside the GKD-C 1 indicator, change the "Confirmation Type" setting to "Confirmation 1"
4. Import the GKD-V indicator into the GKD-C 1 indicator: "Input into C1 or Backtest"
5. Inside the GKD-C 2 indicator, change the "Confirmation Type" setting to "Confirmation 2"
6. Import the GKD-C 1 indicator into the GKD-C 2 indicator: "Input into C2"
7. Inside the GKD-C Continuation indicator, change the "Confirmation Type" setting to "Continuation"
8. Import the GKD-C Continuation indicator into the GKD-E indicator: "Input into Exit"
9. Inside the GKD-BT Backtest, change the setting "Backtest Special" to "GKD Full w/ Exits"
10. Import the GKD-E into the GKD-BT Backtest: "Input into Backtest"
Baseline + Volatility/Volume (Baseline, Volatility/Volume, Backtest)
1. Inside the GKD-V indicator, change the "Testing Type" setting to "Baseline + Volatility/Volume"
2. Inside the GKD-V indicator, make sure the "Signal Type" setting is set to "Traditional"
3. Import the GKD-B Baseline into the GKD-V indicator: "Input into Volatility/Volume or Backtest (Baseline testing)"
4. Inside the GKD-BT Backtest, change the setting "Backtest Special" to "Baseline + Volatility/Volume"
5. Import the GKD-V into the GKD-BT Backtest: "Input into C1 or Backtest"
6. Inside the GKD-BT Backtest, change the setting "Backtest Type" to "Full". For this backtest, you must test Longs and Shorts separately
7. To allow the system to open multiple orders at one time so you can test all Longs or Shorts, open the GKD-BT Backtest, click the tab "Properties" and then insert a value of something like 10 orders into the "Pyramiding" settings. This will allow 10 orders to be opened at one time which should be enough to catch all possible Longs or Shorts.
Requirements
Inputs
Confirmation 1: GKD-V Volatility / Volume indicator
Confirmation 2: GKD-C Confirmation indicator
Continuation: GKD-C Confirmation indicator
Solo Confirmation Simple: GKD-B Baseline
Solo Confirmation Complex: GKD-V Volatility / Volume indicator
Solo Confirmation Super Complex: GKD-V Volatility / Volume indicator
Stacked 1: None
Stacked 2+: GKD-C, GKD-V, or GKD-B Stacked 1
Outputs
Confirmation 1: GKD-C Confirmation 2 indicator
Confirmation 2: GKD-C Continuation indicator
Continuation: GKD-E Exit indicator
Solo Confirmation Simple: GKD-BT Backtest
Solo Confirmation Complex: GKD-BT Backtest or GKD-E Exit indicator
Solo Confirmation Super Complex: GKD-C Continuation indicator
Stacked 1: GKD-C, GKD-V, or GKD-B Stacked 2+
Stacked 2+: GKD-C, GKD-V, or GKD-B Stacked 2+ or GKD-BT Backtest
Additional features will be added in future releases.
Penunjuk Pine Script®